How to Use the AI Chat to write, debug and explain SQL and PL/SQL

This article explains how to use the Gitora AI Chat feature.

The Gitora AI Assistant can help you write, debug, explain and improve SQL and PL/SQL code.

Gitora AI Chat uses OpenAI GPT. If you have not done so already, please follow the steps at this link to create an OpenAI account, register your API Key with the Gitora and open the PL/SQL Editor.

The AI Chat UI

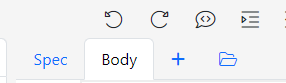
If one is not already open, click the + sign in the editor and open an SQL Pad.
An SQL Pad will show up. Using the plug icon, assign a database connection to the SQL Pad, if it does not have one already.

Gitora uses this database connection to teach AI about the tables and their relationships in your database. Gitora NEVER queries the data in the tables and send them to the OpenAI servers.
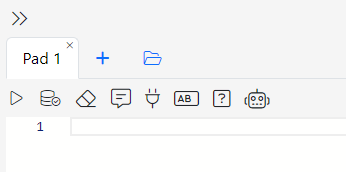
The SQL Pad has two button on the right that are of interest. We’ll start from the robot icon. Click the robot to open the AI Chat window.
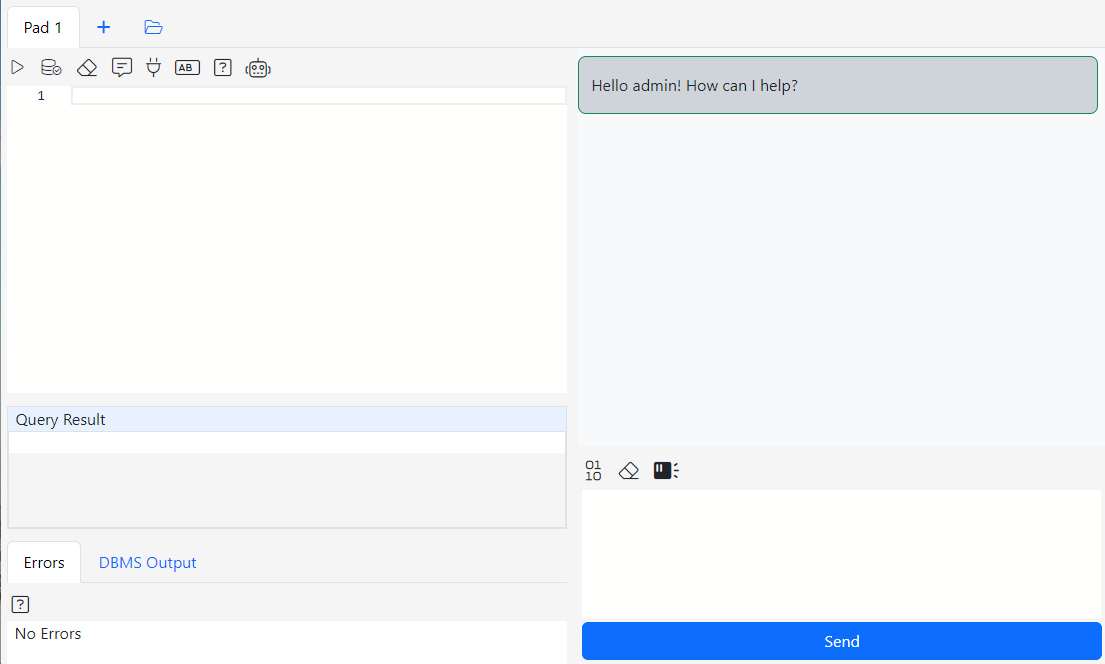
The AI Chat window has two sections. The upper section displays your dialog with the AI. The lower section is where you type your messages to the AI.

The Ai Chat window has a three menu button. From left to right:

SQL Only: Toggling this button on will make the AI skip the explanations and reasoning and return only code.

Start Over: Clicking this button will erase all the context and the previous conversation with the AI.

Table Sensor: The AI examines your message and automatically infers what tables it needs to know about. This feature is on by default and I highly recommend to keep it that way. If you have more than 1500 tables in the schema SQL Pad is connected to and if you are not happy with response times of the AI, experiment with turning the Table Sensor off to improve response times.

Chatting with the Gitora AI Assitant

In this example, we are connected to the Oracle Sample Schema CO which contains the following tables:

CUSTOMERS, INVENTORY, ORDER_ITEMS, ORDERS, PRODUCTS, SHIPMENTS, STORES

We ask the AI to write a query for us: List product inventory for each store.
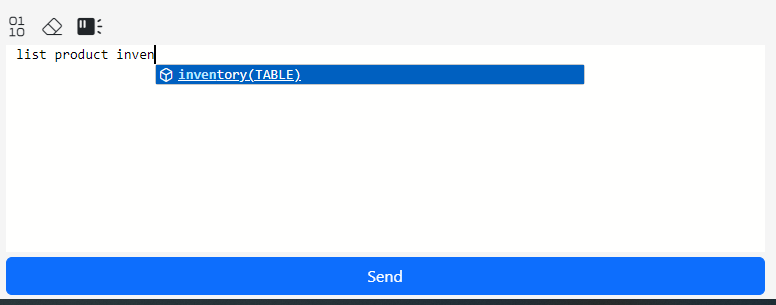
Hint: As you type, the auto suggest feature in the editor recommends completions. Making a selection from the list will add the selected table to the AI’s context explicitly. If the Table Sensor is on, making a selection is unnecessary almost all the time. So do not feel compelled to make a selection or get the table name right. The AI will figure it out. However, if the Table Sensor is off, making an explicit selection from the completions dialog is the only way you can inform the AI about the context of the question.

Pressing the Enter key or clicking the Send button will submit your message. In a few seconds, the AI response will show up.
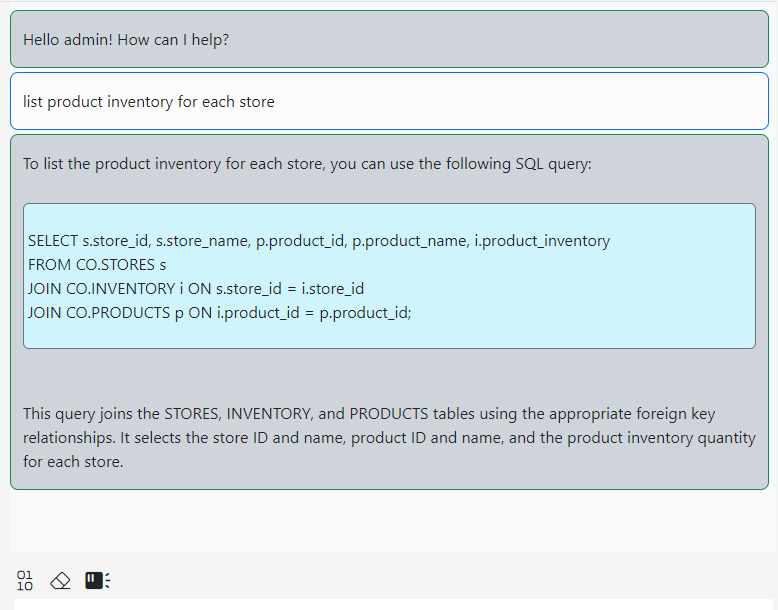
There are a few things you can do with this response. Hover your mouse over the highlighted SQL in the AI response. A menu will show up.
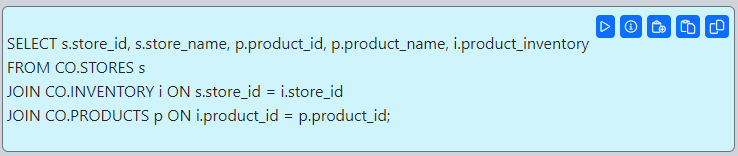
From left the right, the menu buttons are as follows:

Execute: Runs the Ai generated SQL and displays the results in the SQL Pad.

Info: Hovering over this menu item, lists the tables the AI considered while generating the query.
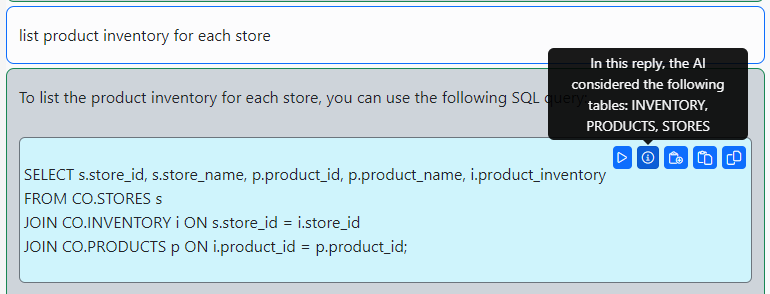
Hint: If the Table Sensor is on and you do not see a table that you expect the AI to include to the query, in the information popover, then add the table to your next message. For example write something like “Use ORDER_ITEMS table.”

Append to Pad: Appends the query to the SQL Pad.

Paste to Pad: Overwrites the text in the SQL Pad and pastes the query.

Copy: Copies the query to the clipboard.

The AI does not always produce correct SQL queries. If this is the case, you can inform the AI about the error to help it fix its mistake.

For example, if write the following message, the AI creates an invalid query:

product count per store

The AI produces the following query:

SELECT s.store_id, s.store_name, COUNT(p.product_id) AS product_count
FROM stores s
LEFT JOIN products p ON s.store_id = p.store_id
GROUP BY s.store_id, s.store_name;

This query is wrong because there is not relationship between the STORES and the PRODUCTS table. Executing the query using the Execute menu button produces an error that is visible in the SQL Pad’s error tab.
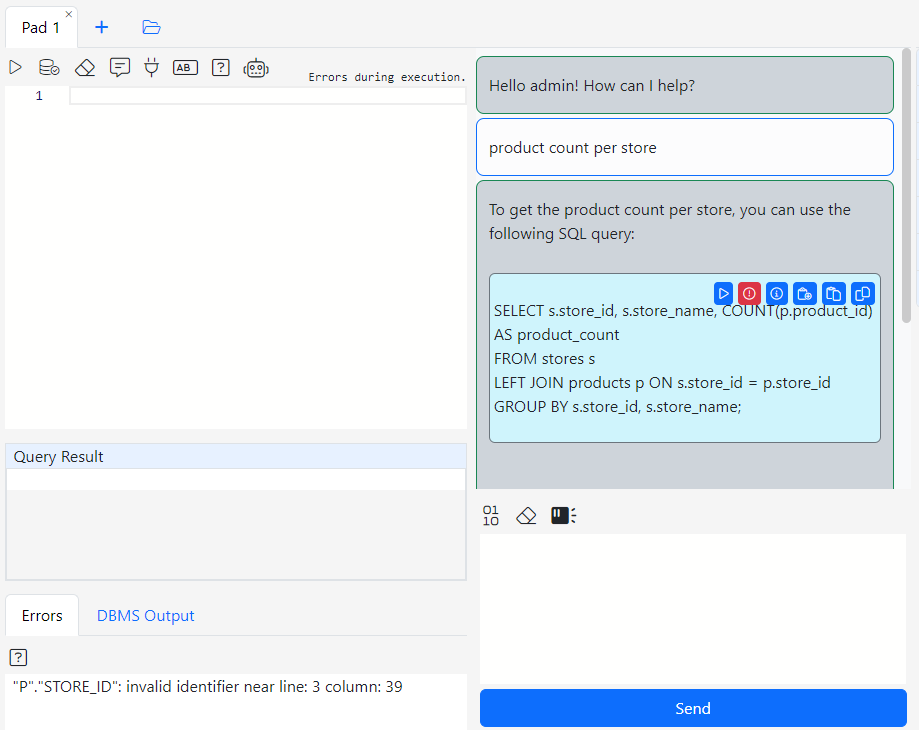
Note the new red button that showed up in the menu. Gitora detected that the query did not run successfully and displayed the “Send Error to AI” button. Click this button to inform the AI about the error. Gitora will automatically package the query and the error and send a message to the AI on your behalf.
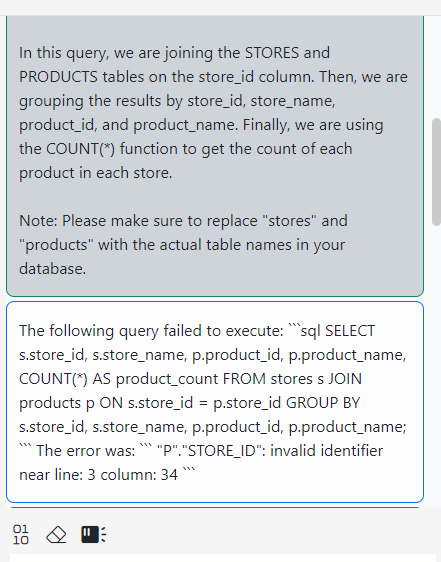
Using the AI Assistant to Analyze Errors

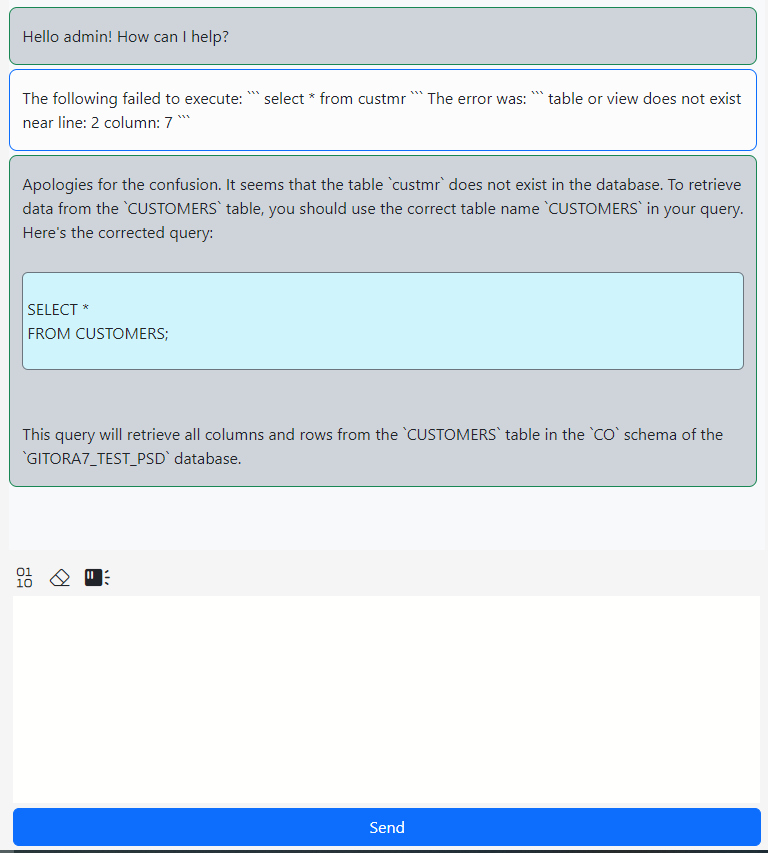
The Gitora AI Assistant can also be used to analyze errors during SQL, PL/SQL execution.

In the screenshot below, I wrote a simple query but misspelled the table name.
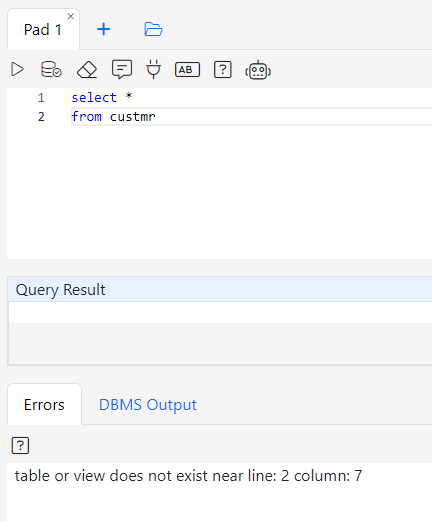
Clicking the question mark button under the Errors tab sends the error message along with the text (or the selected text) in the SQL pad to the AI Assistant like so:
Using the AI Assistant to Explain Queries

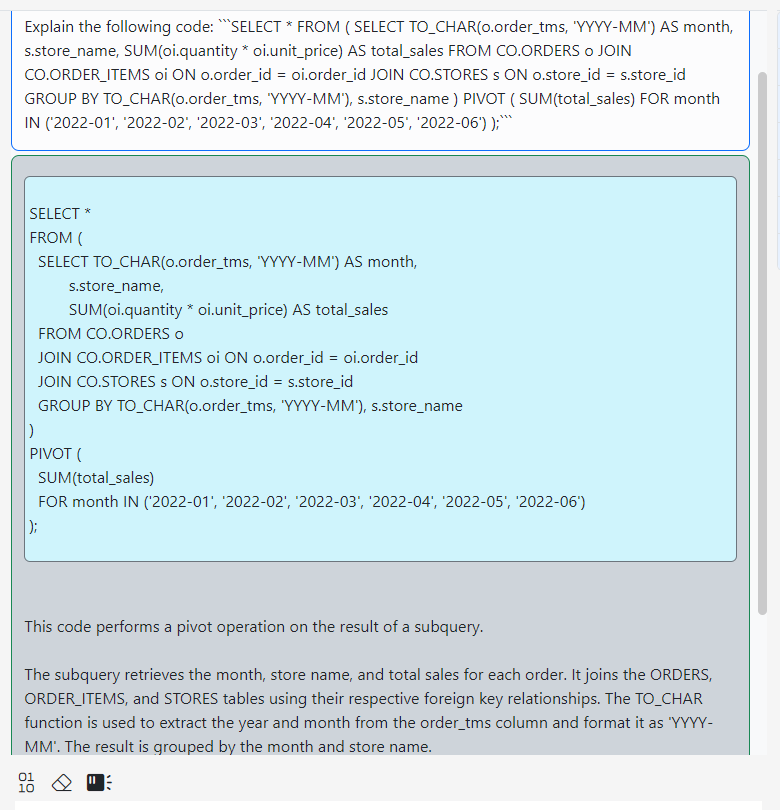
The AI Assistant can also be used to explain SQL queries (and PL/SQL blocks.)

In the screenshot below , the SQL pad contains an SQL query with the PIVOT command.
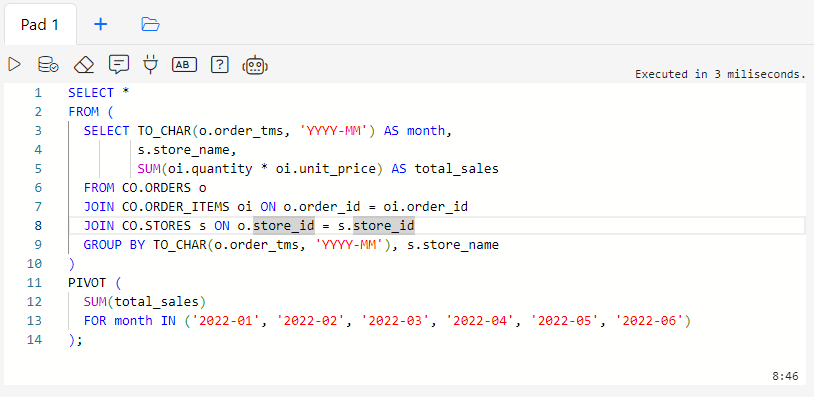
Clicking the question mark button in the toolbar will send a message to the AI Assistant asking it to explain the code.
These are just a few examples about how you can use the Gitora AI Assistant and its schema-aware capabilities. OpenAI GPT models are very capable and I am sure you will come up with many more use cases.

How to Use The Gitora AI Assistant

This article explains how to configure and use the Gitora AI Assistant.

Create an OpenAI Account

Gitora AI Assistant uses OpenAI GPT to suggest PL/SQL code, functions, procedures and SQL in real time, right from the editor. Therefore it requires an OpenAI account and subscription. The OpenAI subscription is on a pay-as-you-go basis and is extremely affordable. To give you a rough idea, during the development of this feature I’ve spent about a dollar a month to use the OpenAI API’s.

You can create your account from the OpenAI website.

Enter Your Credit Card Information

After you create your account, go to Manage Account -> Billing -> Payment Methods and enter your credit card information. You will only be billed for what you use.

Generate an API Key

Finally, generate your API Key. You will enter this key to the Gitora PL/SQL Editor so that it can start making suggestions while you code.

Start The Gitora PL/SQL Editor

From the home screen, register a database and a database user if you have not already done so. To learn how you can register a database and a database user please read Getting Started with the Gitora PL/SQL Editor.

Click one of the connect buttons in the home screen. The PL/SQL Editor will open in a new tab.

Note the new AI icon on the toolbar of the PL/SQL Editor.

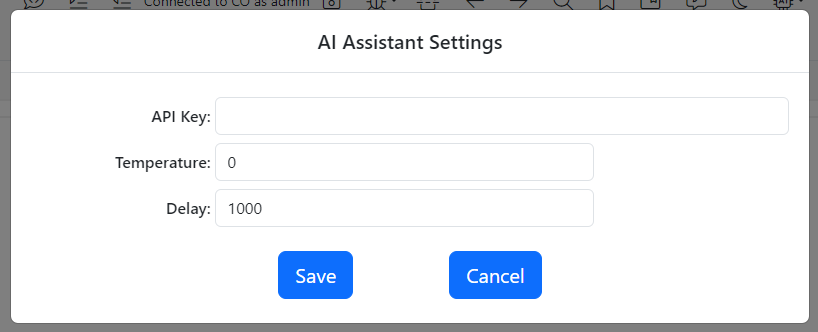
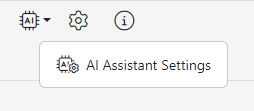
Click the small arrow text to the AI icon. The AI Assistant Settings button will show up.

Click the button. The AI Settings dialog will show up.

Enter your Open API Key to the API Key field.

The settings dialog has two more parameters:

Temperature: This is the setting that tells the AI how creative it should be while making suggestions. It accepts any value between 0 and 2. In my experience, 0 worked best but feel free to experiment with different values.

Delay: The AI Assistant makes suggestions when you stop typing. This is the amount of time it waits in milliseconds, before it starts the process to come up with a suggestion. 1000 milliseconds may be a little bit on the higher end depending on your style. I recommend you to experiment with lower values such as 500, 250 etc…

The shorter the delay, the more requests Gitora will make to the OpenAI API, meaning you will spend more money. The API is extremely affordable though so I don’t think this will be an issue but I thought I’d mention it. At the time of the writing of this tutorial, the API costs about $0.002 per 1,000 tokens. 1000 tokens is about 750 words. Again, for reference, I spent about a dollar a month while building this feature.

After you are done with the AI Settings Dialog, click save.

The AI icon should turn black on the toolbar to indicate that the AI is on. (or if you are in the dark mode, the icon will turn white.) If it is not turn on, click the AI icon to enable it. Clicking the icon again will disable the AI Assistant.

From this point on, by default, the AI Assistant will be enabled whenever you open a new PL/SQL Editor as long as you have a registered OpenAI API Key.

If you’d like to remove your OpenAI API Key, enter a space character as the API Key in the AI Assistant Settings dialog and click save.

Using the Gitora AI Assistant

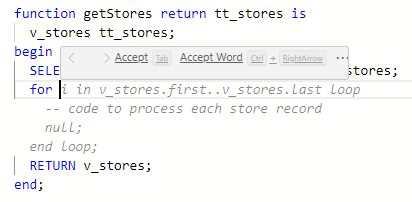
Open a package or any code object and start coding. You can also open an SQL Pad. When you stop typing, the code suggestions of the AI Assistant will show up as lightly colored text in the editor. Click the tab button to accept the code suggestion. If you’d like to accept just a part of the suggestion, hover over the suggestion. A small dialog window will pop up.

Using this dialog, you can accept individual words in the suggestion.

That’s it! Happy coding!

Configuring the PL/SQL Debugger

Gitora Editor includes a PL/SQL debugger. For the PL/SQL debugger to work, the database session being debugged must be able to access the debugger. This requires you or your DBA to open a port or a range of ports in your Oracle database. To achieve this, follow the steps below:

  1. Execute the script at gitora/GITORA_DEBUGGER_ACL_SCRIPT.sql in the zip file, for every database user that you’d like to use with the debugger. The script is a very small PL/SQL code block:

begin
DBMS_NETWORK_ACL_ADMIN.APPEND_HOST_ACE(
host => '192.168.1.42',
lower_port => 4000,
upper_port => 4999,
ace => xs$ace_type(privilege_list => xs$name_list('jdwp'),
principal_name => [ORACLE_USER_NAME],
principal_type => xs_acl.ptype_db));
end;

Replace the [ORACLE_USER_NAME] in the text above with the actual name of the Oracle user that you want to be able to use with the debugger and execute the script. Run this script once for every Oracle user that needs to be able to connect to the debugger.

Change the start and end port numbers (both inclusive) as you see fit.

  1. Update the following parameters in the Settings.properties file.

debug.port.range.start: Set this value to the same value you used for the lower_port input parameter.

debug.port.range.end : Set this value to the same value you used for the upper_port input parameter.

debug.server.ip: This is the IP address of the Apache Tomcat server that is running the Gitora Editor web application. This is NOT your desktop’s IP address (although it could be if you are running Gitora locally.) This IP address will be used by the Oracle database session to be able to find and connect to the Gitora debugger.

Below is an example of how the three parameters are set:

debug.port.range.start = 4000
debug.port.range.end = 4999
debug.server.ip = 192.168.1.42

Gitora PL/SQL Debugger

This tutorial explains how to use the PL/SQL debugger that comes with the Gitora PL/SQL Editor.

Open a database object in the editor. Next, click the debug icon in the editor to activate the debug mode.

The icon changes color. The change of color indicates that the open database object (in our example, a PL/SQL package), is now compiled in debug mode. As long as the debug icon has color, every save you make will compile the object in debug mode.

Click left of the line numbers to create a breakpoint. Click again to remove the breakpoint.

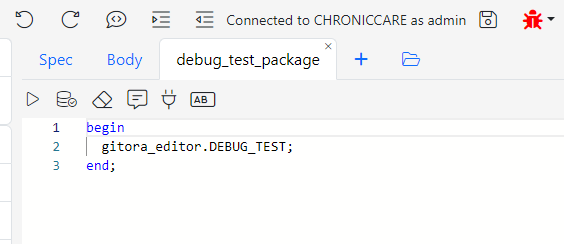
Create a new SQL Pad to run the procedure/function with the breakpoint.

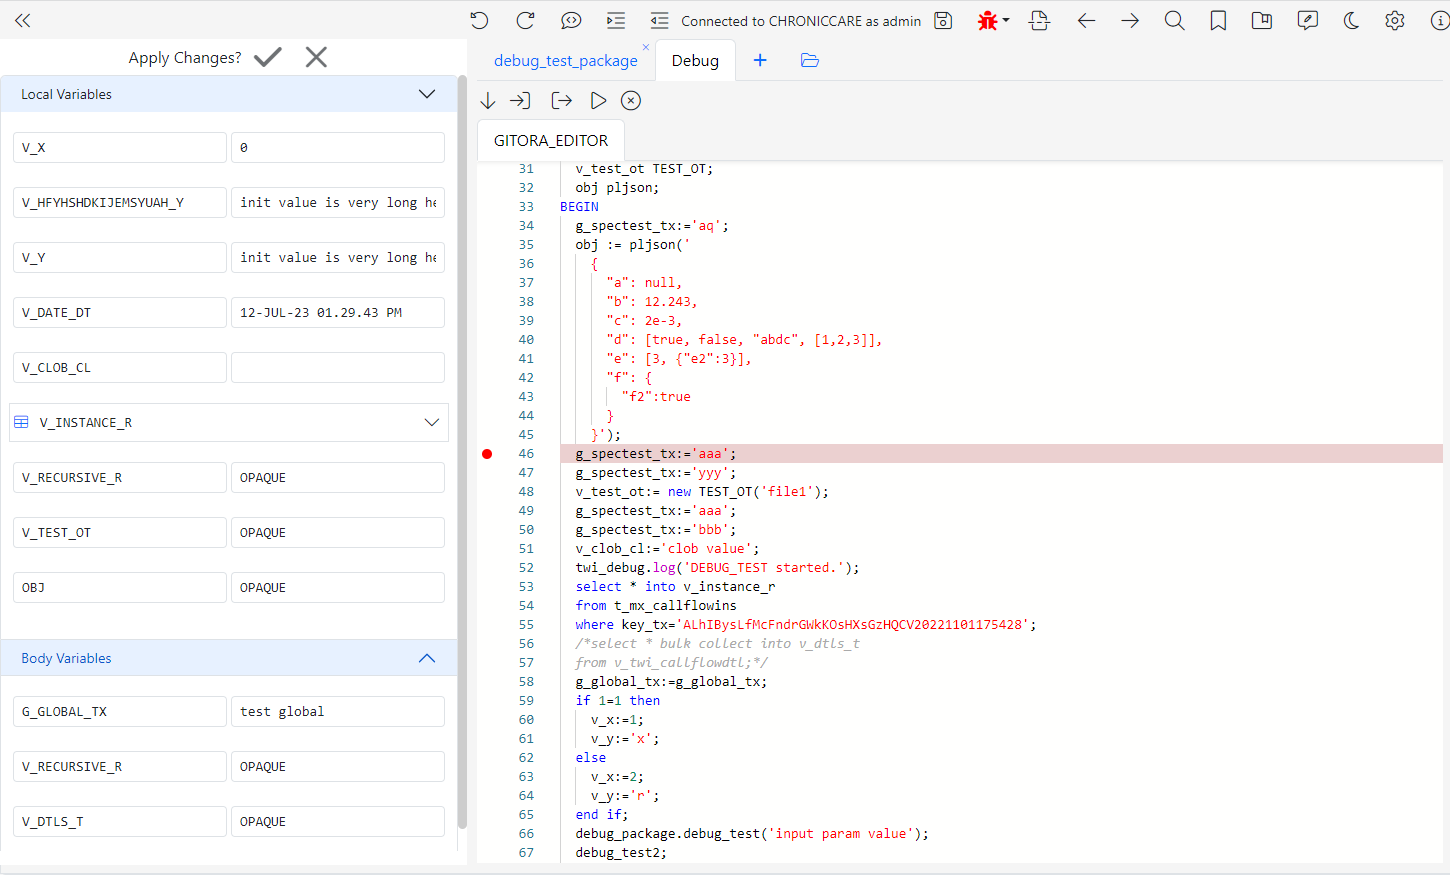
Click the Run button to execute the PL/SQL code block. The execution will stop at the breakpoint. The Debug Tab will show up.

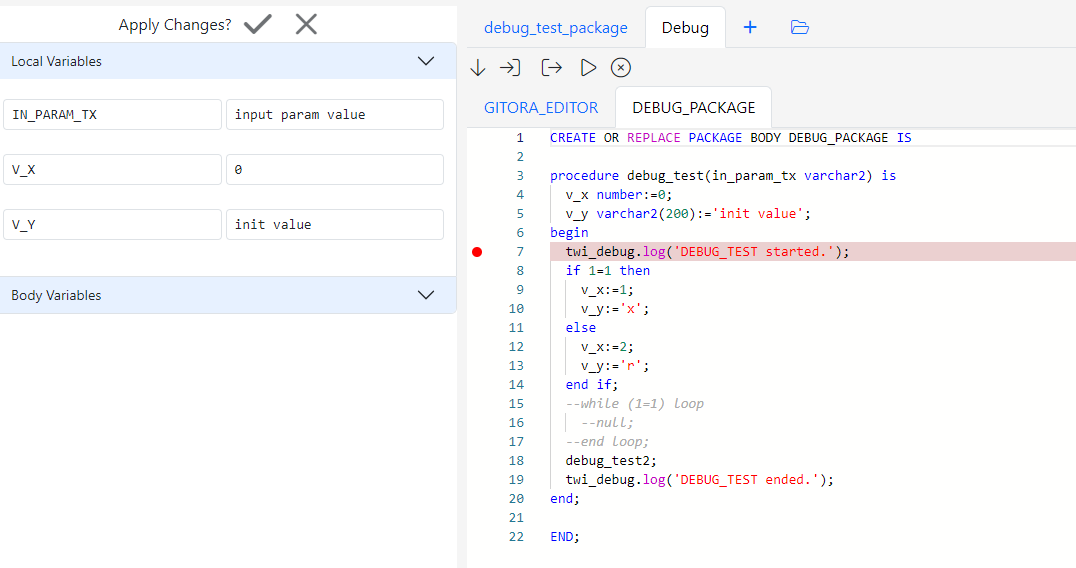
On the left side of the editor, you can view the current parameters and their values. Please note that, Oracle does not provide support to view the values of every variable type.

In the middle of the screen, you will see that the execution has stopped at the breakpoint. You can add additional breakpoints, or remove existing ones while debugging.

The debug tab toolbar has five buttons that should be familiar to all programmers. From left to right, you can Step Over, Step In, Step Out of each line of code. The forth button is to resume the execution until the next breakpoint. If there are no breakpoints, the PL/SQL block will execute until completion. The final button suspends all breakpoints for the duration of one execution.

Changing Runtime Values of Variables

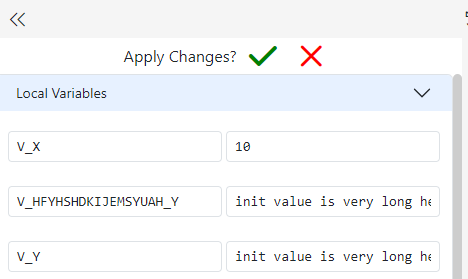
Gitora PL/SQL Debugger enables you to change the values of PL/SQL variables during runtime. To change the value of a variable, simply update its value on the left of the screen. To apply your changes to the execution, click the checkbox button at the top of the current parameters view.

Click the X button if you’d like to revert the changes you made to the variable values.

Adding Breakpoints to Multiple Database Objects

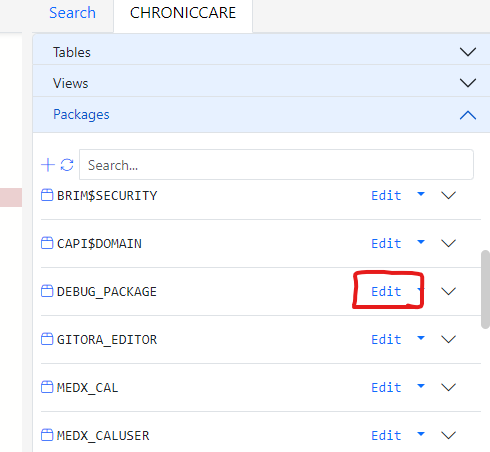
In our example, the GITORA_EDITOR.DEBUG_TEST procedure references other procedures, for example the DEBUG_PACKAGE.DEBUG_TEST procedure. You may want to add additional breakpoints to those procedures as well.

To achieve this, locate the procedure in the Schema Navigator and click edit as shown below.

The package opens in another browser tab. Since we activated the debug mode, the new tab is also opened in debug mode. Therefore, the DEBUG_PACKAGE is already compiled in debug mode.

Set a breakpoint in the DEBUG_TEST procedure. Go back to the first browser tab and run the PL/SQL block again.

First, the execution will stop at our initial breakpoint. Click the resume button and the execution will stop at the new breakpoint we created in the DEBUG_PACKAGE.DEBUG_TEST procedure.

Joining a Debug Session

It is also possible to join an existing debug session if you already have a PL/SQL object open in an editor.

Lets assume that we already had the DEBUG_PACKAGE open and would like to add a breakpoint.

Click the triangle icon to the right of the debug button. You will see an additional button

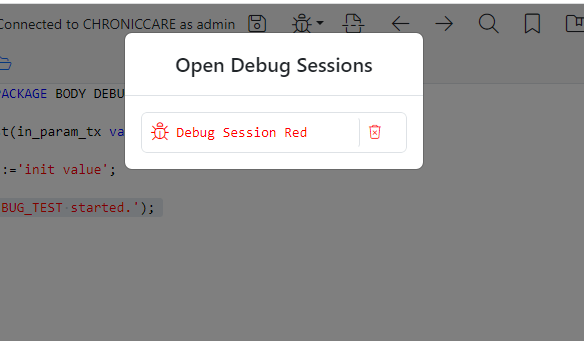
Click Join Existing Debug Session button. The Open Debug Sessions dialog shows up.

Click on the “Debug Session Red” button and the package will become part of your debug session.

Multiple Debug Sessions

Gitora Editor can manage multiple debug sessions concurrently. Each debug session is identified with a unique color for the debug icon. For example, all tabs with a red debug icon belong to the same debug session.

To create a new debug session, open two database objects in separate tabs as shown below

In the GITORA_EDITOR tab, click the debug icon to make it red (if it is not already). In the DEBUG_PACKAGE tab, click the same debug icon. The debug icon will turn blue indicating that the DEBUG_PACKAGE is in a different debug session than the GITORA_EDITOR.

Breakpoints are only visible to the debugger if they are in the same sessions. For example, in the setup above, breakpoints you will create in DEBUG_PACKAGE will not be visible to the other tab that has the GITORA_EDITOR open, because that tab is in a different debug session.