This tutorial explains how to use the PL/SQL debugger that comes with the Gitora PL/SQL Editor.
Open a database object in the editor. Next, click the debug icon in the editor to activate the debug mode.
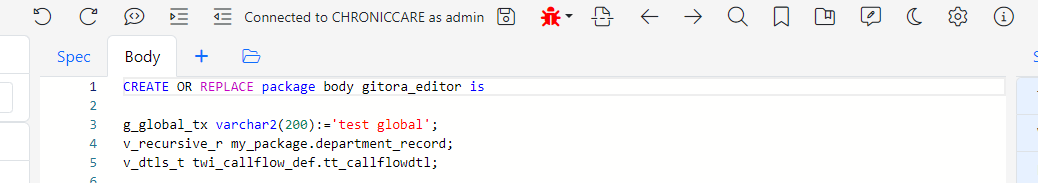
The icon changes color. The change of color indicates that the open database object (in our example, a PL/SQL package), is now compiled in debug mode. As long as the debug icon has color, every save you make will compile the object in debug mode.
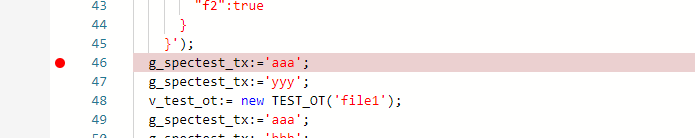
Click left of the line numbers to create a breakpoint. Click again to remove the breakpoint.
Create a new SQL Pad to run the procedure/function with the breakpoint.
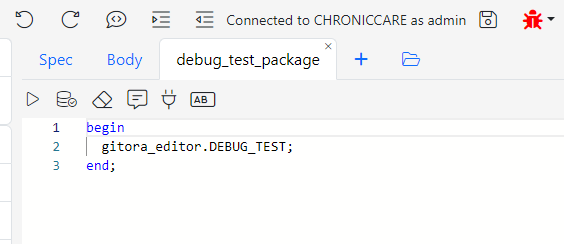
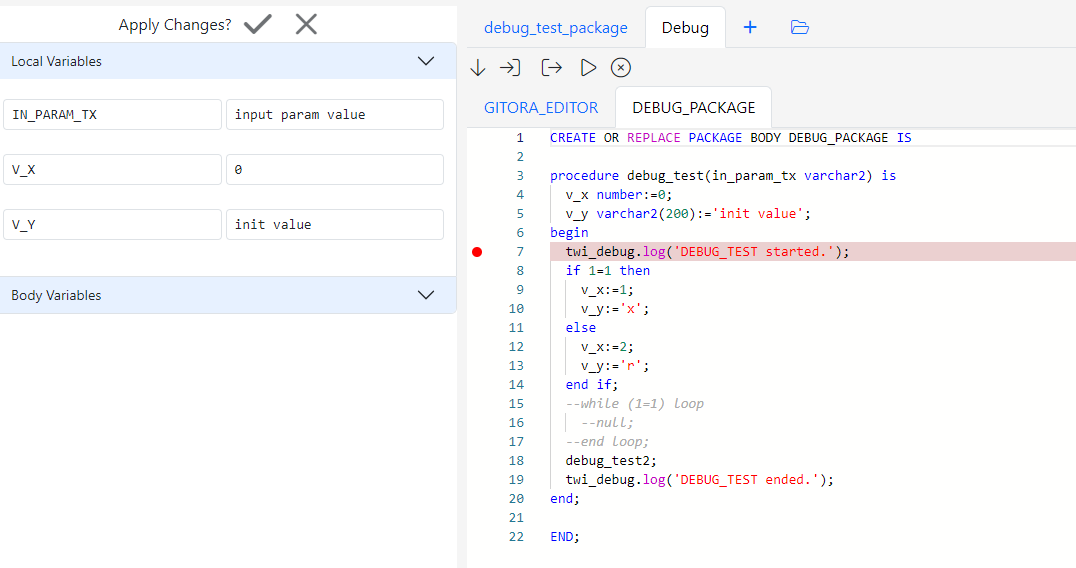
Click the Run button to execute the PL/SQL code block. The execution will stop at the breakpoint. The Debug Tab will show up.
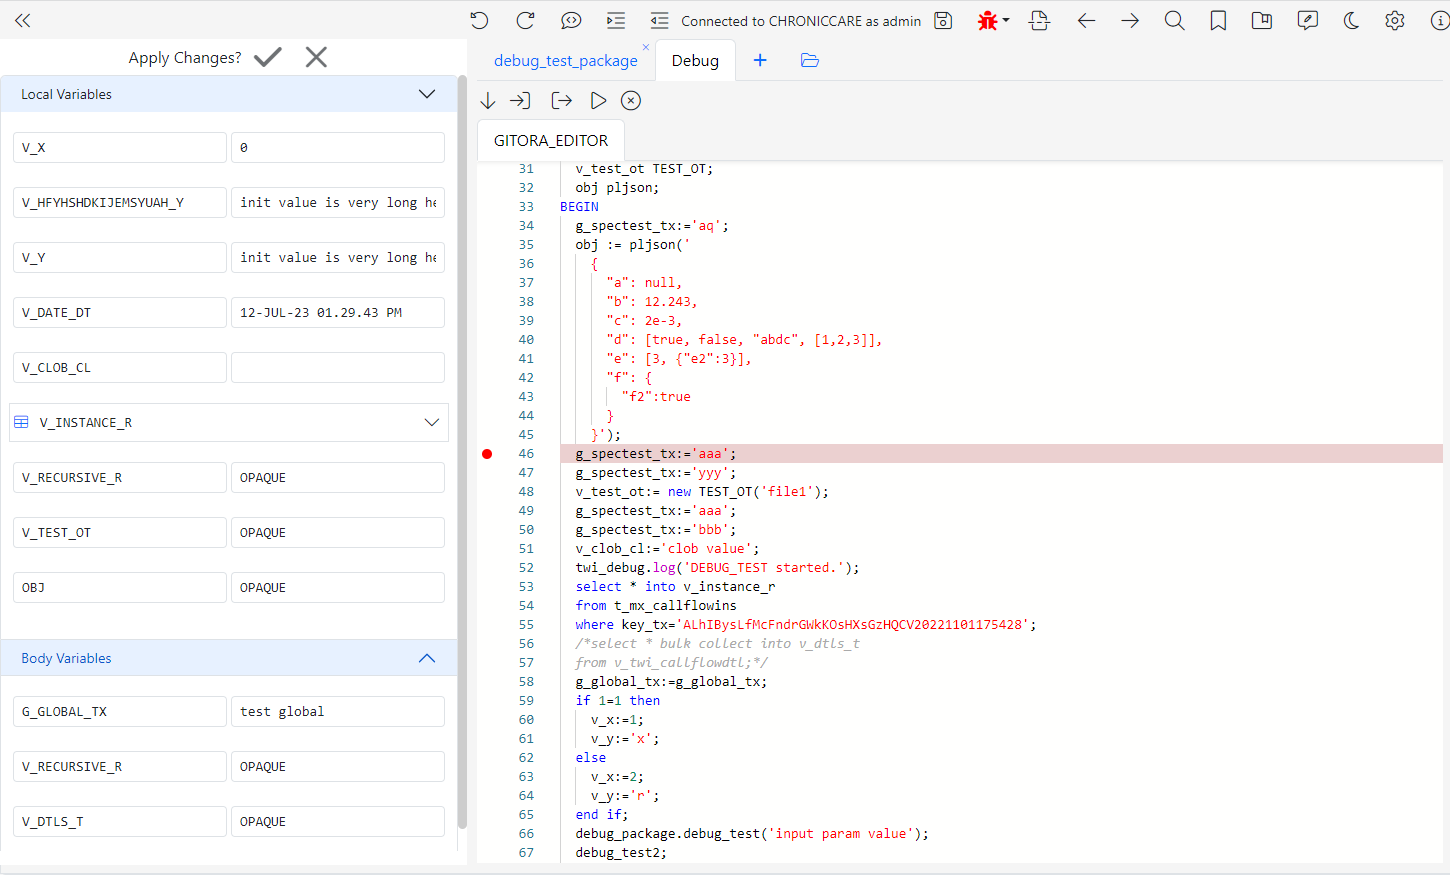
On the left side of the editor, you can view the current parameters and their values. Please note that, Oracle does not provide support to view the values of every variable type.
In the middle of the screen, you will see that the execution has stopped at the breakpoint. You can add additional breakpoints, or remove existing ones while debugging.
The debug tab toolbar has five buttons that should be familiar to all programmers. From left to right, you can Step Over, Step In, Step Out of each line of code. The forth button is to resume the execution until the next breakpoint. If there are no breakpoints, the PL/SQL block will execute until completion. The final button suspends all breakpoints for the duration of one execution.
Changing Runtime Values of Variables
Gitora PL/SQL Debugger enables you to change the values of PL/SQL variables during runtime. To change the value of a variable, simply update its value on the left of the screen. To apply your changes to the execution, click the checkbox button at the top of the current parameters view.
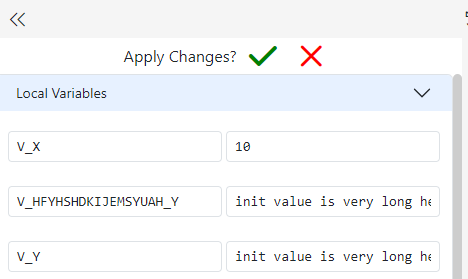
Click the X button if you’d like to revert the changes you made to the variable values.
Adding Breakpoints to Multiple Database Objects
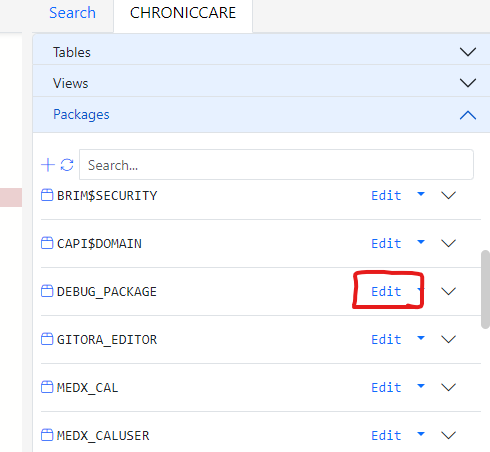
In our example, the GITORA_EDITOR.DEBUG_TEST procedure references other procedures, for example the DEBUG_PACKAGE.DEBUG_TEST procedure. You may want to add additional breakpoints to those procedures as well.
To achieve this, locate the procedure in the Schema Navigator and click edit as shown below.
The package opens in another browser tab. Since we activated the debug mode, the new tab is also opened in debug mode. Therefore, the DEBUG_PACKAGE is already compiled in debug mode.
Set a breakpoint in the DEBUG_TEST procedure. Go back to the first browser tab and run the PL/SQL block again.
First, the execution will stop at our initial breakpoint. Click the resume button and the execution will stop at the new breakpoint we created in the DEBUG_PACKAGE.DEBUG_TEST procedure.
Joining a Debug Session
It is also possible to join an existing debug session if you already have a PL/SQL object open in an editor.
Lets assume that we already had the DEBUG_PACKAGE open and would like to add a breakpoint.
Click the triangle icon to the right of the debug button. You will see an additional button
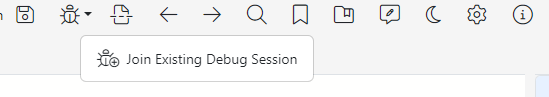
Click Join Existing Debug Session button. The Open Debug Sessions dialog shows up.
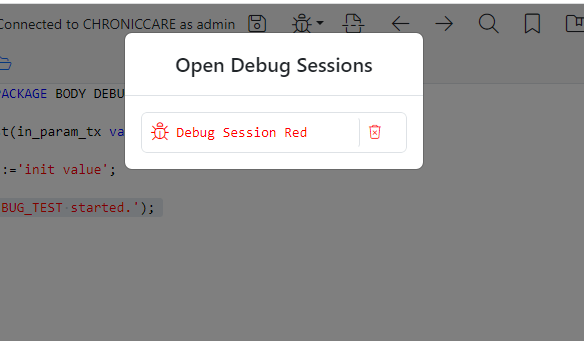
Click on the “Debug Session Red” button and the package will become part of your debug session.
Multiple Debug Sessions
Gitora Editor can manage multiple debug sessions concurrently. Each debug session is identified with a unique color for the debug icon. For example, all tabs with a red debug icon belong to the same debug session.
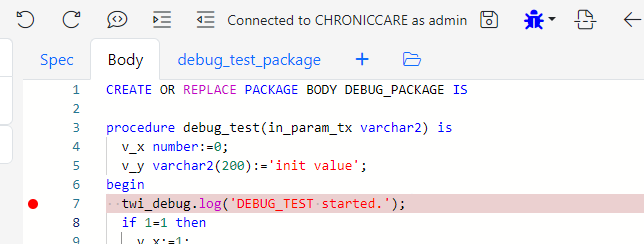
To create a new debug session, open two database objects in separate tabs as shown below

In the GITORA_EDITOR tab, click the debug icon to make it red (if it is not already). In the DEBUG_PACKAGE tab, click the same debug icon. The debug icon will turn blue indicating that the DEBUG_PACKAGE is in a different debug session than the GITORA_EDITOR.
Breakpoints are only visible to the debugger if they are in the same sessions. For example, in the setup above, breakpoints you will create in DEBUG_PACKAGE will not be visible to the other tab that has the GITORA_EDITOR open, because that tab is in a different debug session.